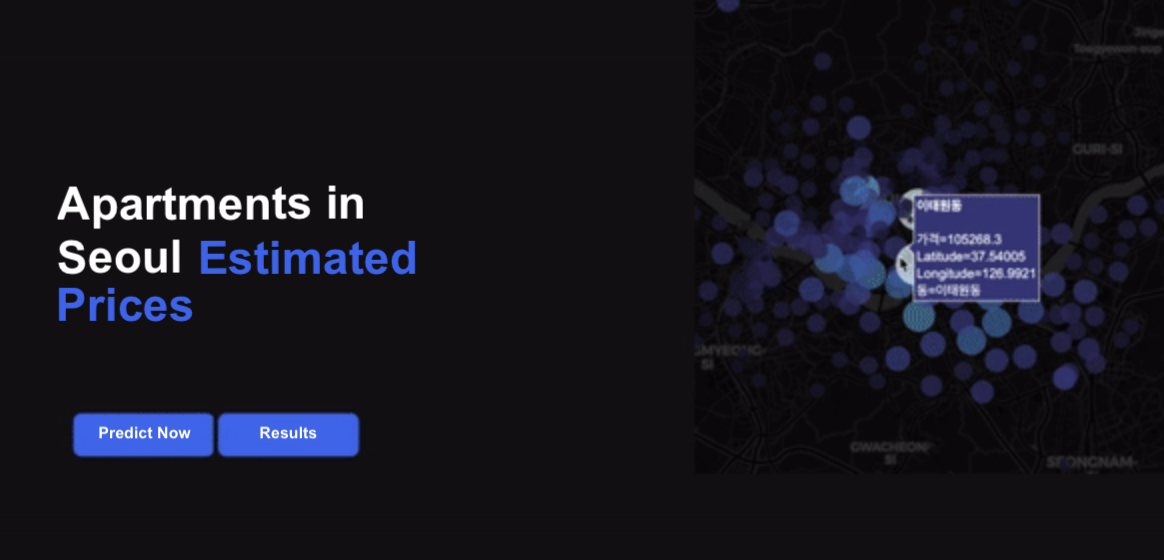
Seoul's apartment price now averages $1 million.
Soaring house prices in Korea is a fatal problem. Aiming to visualize the data, predict the price rate at a certain time, we hoped to provide a clue to the clueless yong people who are saving money.

Soaring house prices in Korea is a fatal problem. Aiming to visualize the data, predict the price rate at a certain time, we hoped to provide a clue to the clueless yong people who are saving money.
There exists a vast amount of data provided from the ministry of Korea to analyze apartment prices of Korea. Whilst the prices are fluctuating but definitely skyrocketing, it is important to collect the valid data, and enact prediction for us to get the littlest grasp of the future prices. We aimed to add data visualization for a general explication on the trend, and future predictions.

Numerous machine learning projects end as a project. We devised the algorithm and back-end developed it to a website, deploying the framework Django.

Price prediction project and launching a website
Machine learning modeling, data analysis, back-end, front-end development
Data visualizaiton, data processing, front-end development
Hyungjoon Kim: project lead, machine learning, back-end
Jihoon Kim: data analysis, data pre-processing

The 'provided data' from Dacon Tournament (from 2008 to 2017.11) was collected. Then, we had to further collect the data those from 2017.12 ~ 2012.12 from the Korean National Price Open System, through crawling. The columns used are ‘dong’, ‘jibun’, ‘Apt_name’, ‘use_area(m2)’, ‘transaction_year’, ‘transaction_month’, ‘date(1~10)’, ‘date(11~20)’, ‘date(21~)’, ‘floor’, ‘year_found’.
We then processed the data according to the date (early, middle, late) through one-hot encoding. We replaced the outlier and anomaly to dummy data. Converting the data to Object type, we label encoded the apartment name and dong (town name) and finally checked the irregularity in correlation. Following was the sorted data:

Finding the right model was as follows. Rather than having random extraction as the train data, we manually selected data from fairly even distribution on the year, month and day data, and used the LignGBM model for the algorithmic modeling. Compared to XGBoost, Light GBM was deemed more efficient in terms of memory consumption as well.
| LighGBM | XGBoost |
|---|---|
| Histogram-based decision algorithm | Sorted-based decision algorithm |
| => Efficient in memory consumption | => Faster training speed |
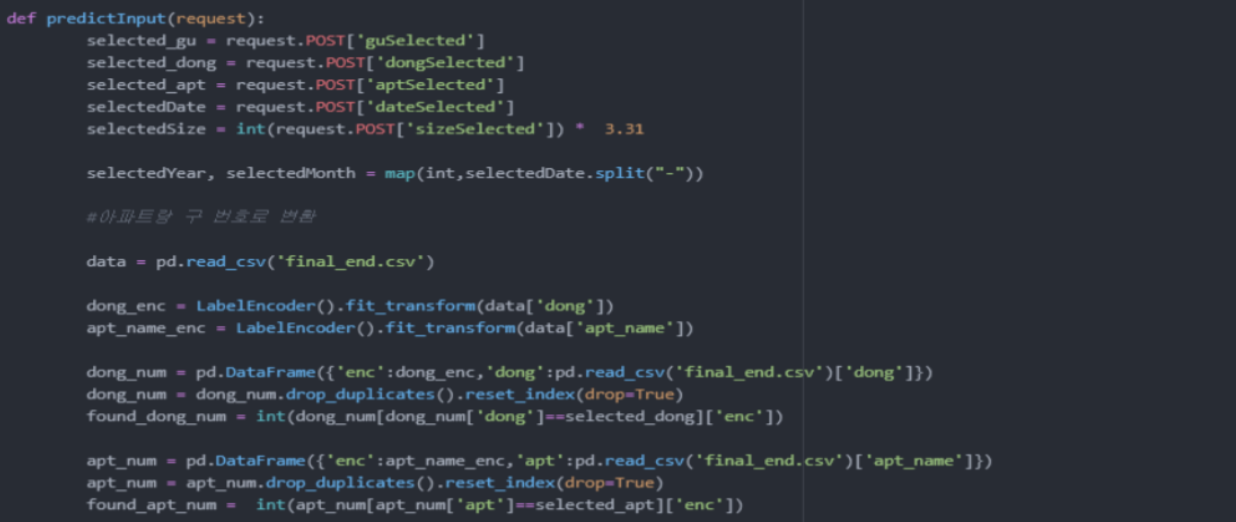
Setting the train data at 90% and test data at 10% with total amount of data (985,094), validation scoring was conducted. We analyzed that score metrics of RMSE was 0.09. Based on the python generated models and processed data, we aimed to deploy the Django Framework as the core framework to the prediction website. The website construction plan is as follows:


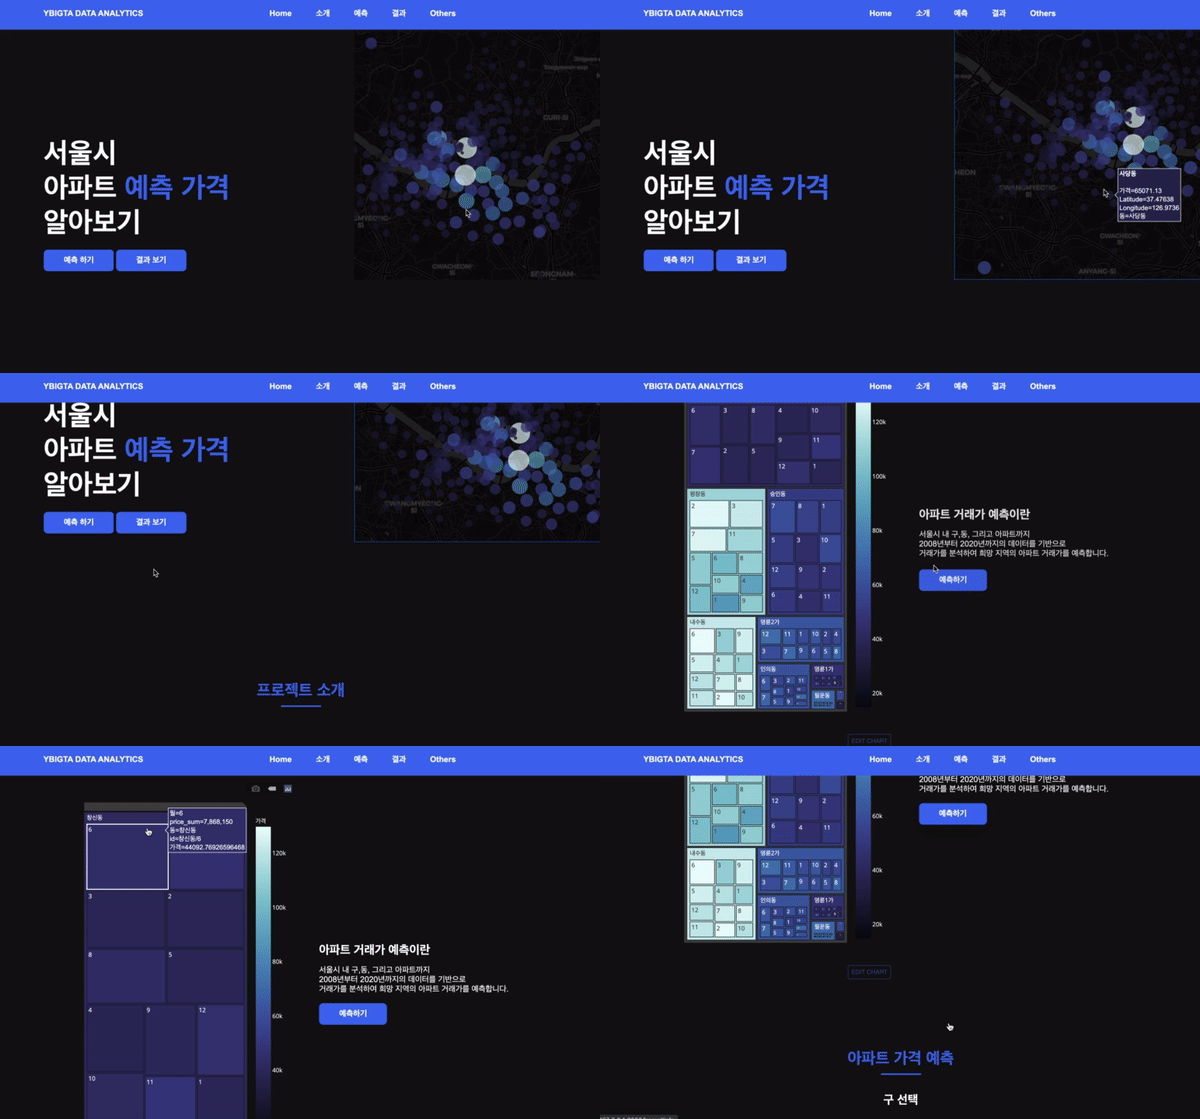
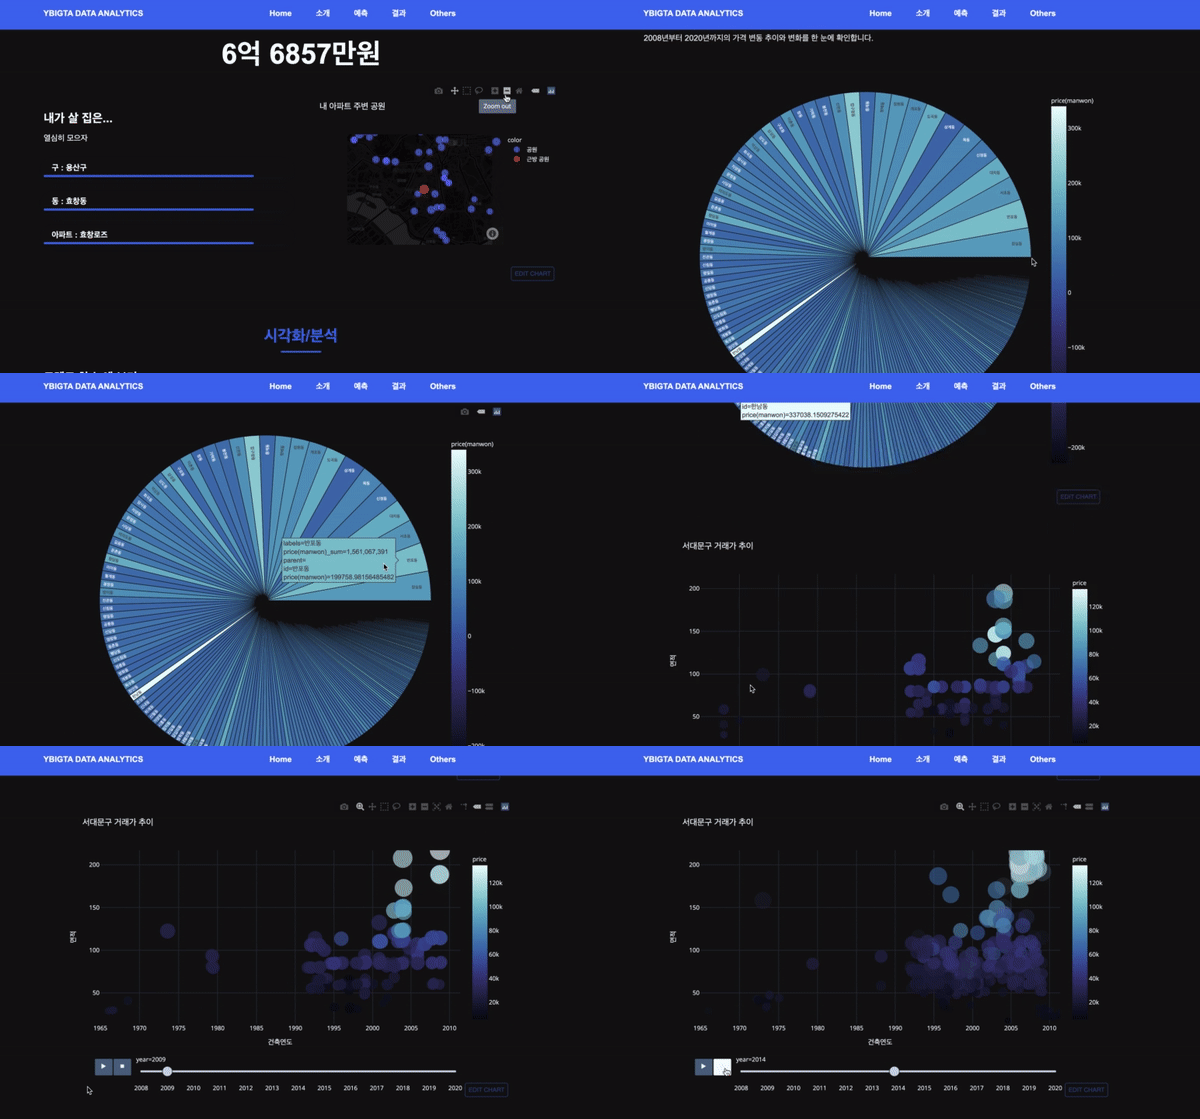
Alongside the prediction, general data representation on seoul's fluctuating prices according to the selected variables are showcased in the website. Responsive visualization is conducted upon the users' requests.


The live-functioning website is deployed with pythonanywhere.com considering our model heavily relies on the python framework.
Nonetheless, since the embedded data is enormous and the LightGBM model takes time to produce the result, the website may load for a while, so if in hurry, here is the video of the final output.